Debugging Adams Python Scripts with Vscode
The Adams View python scripting library is a powerful tool for analysts looking to automate tasks. Unfortunately for me, I avoided using this lovely tool for far too long for one reason: I couldn’t do line by line debugging. This is a complete deal breaker for writing code with any serious complexity. Even Adams CMD has this feature (as crude as it may be). In this post, I’ll show you how to use the debugging tools built into the python extension for vscode to debug scripts in Adams. I’ll also introduce a feature in the MSC Adams vscode extension that makes this workflow even easier.
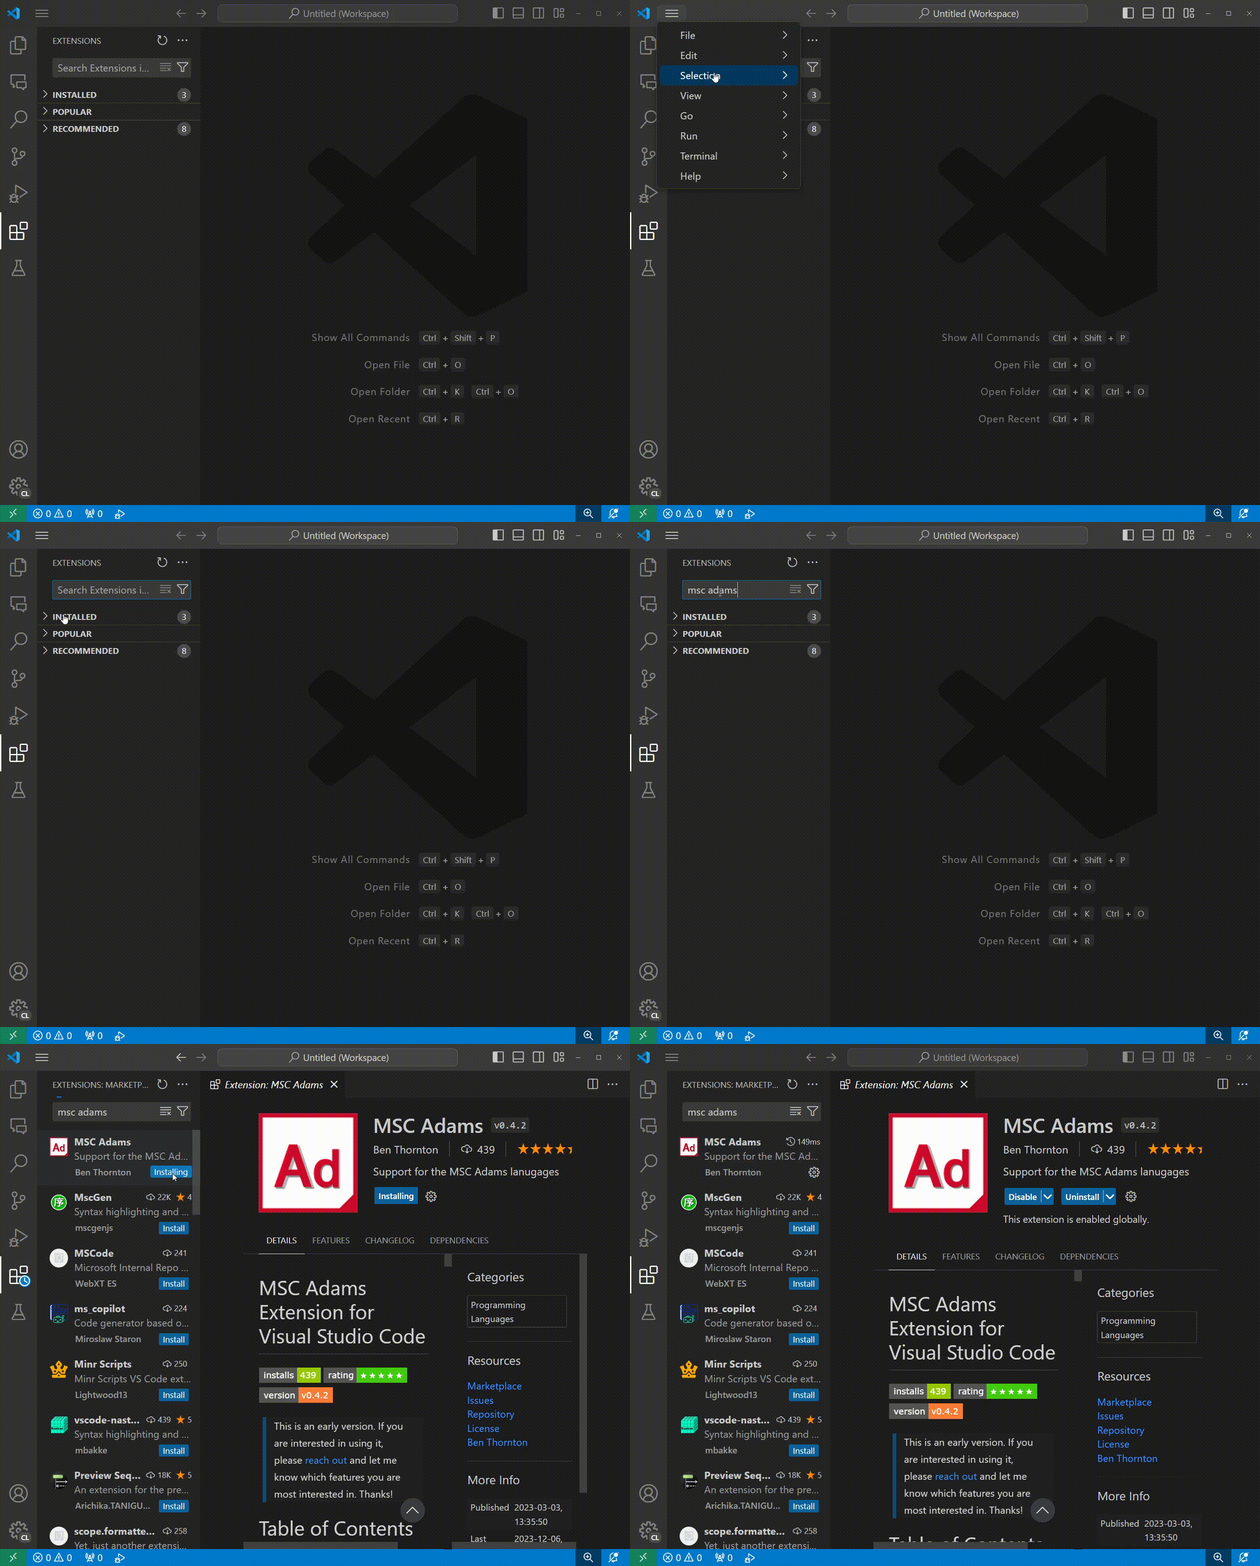
Install the MSC Adams Extension
If you haven’t already installed the MSC Adams extension, you can do so through vscode itself. Here’s how:

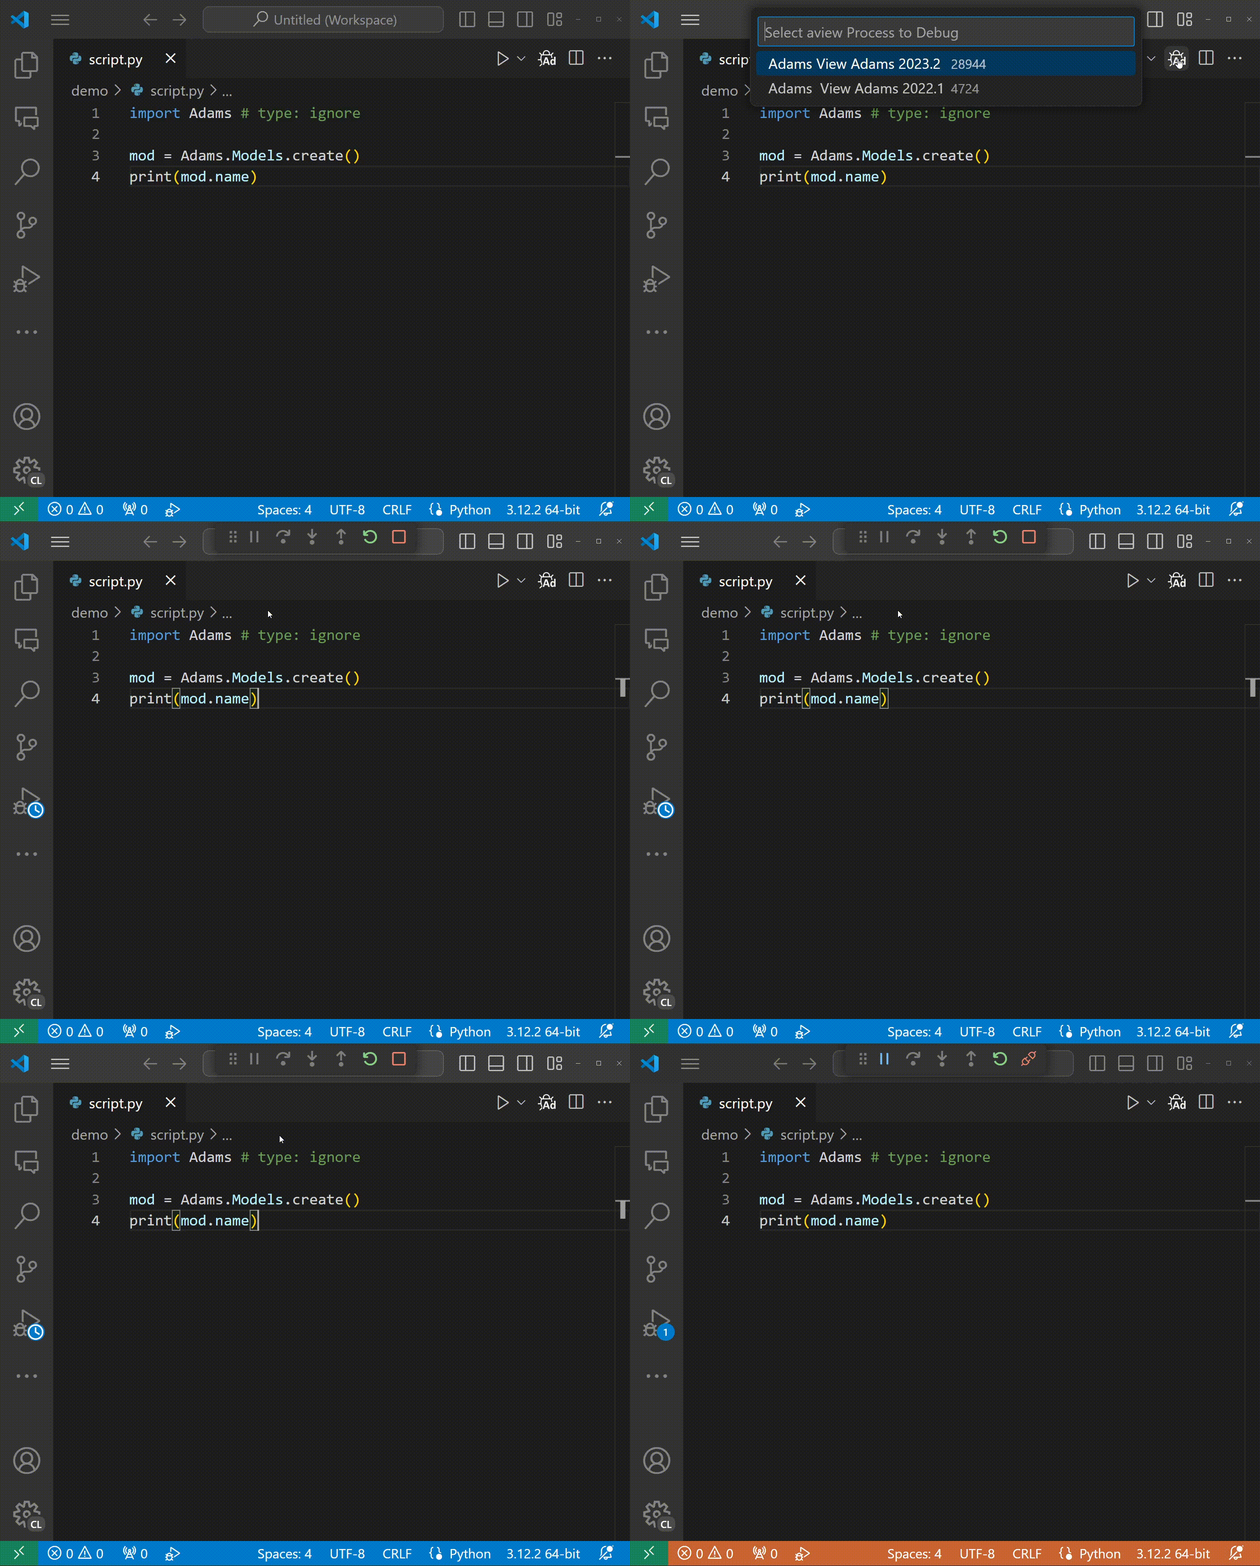
Attach the debugger
import threading. You can also automate this by adding
var set var=.mdi.tmp_int int=(eval(run_python_code("import threading"))) to one of your aview
startup scripts (e.g. aviewAS.cmd).Open Adams View (this step works best if you only have one instance of Adams View open). Once installed, open a python script in vscode (you can use the one below).
import Adams # type: ignore

mod = Adams.Models.create()
print(mod.name)
Once you have a python script open, the Debug Python Script In Adams button will appear. Click this to attach the debugger. If you have more than one instance of Adams View open, you will be prompted to select one.

Adams Car
Debugging is supported in Adams Car too! See Debugger not breaking when attached to Adams Car if you are having trouble getting the debugger to break in Adams Car.
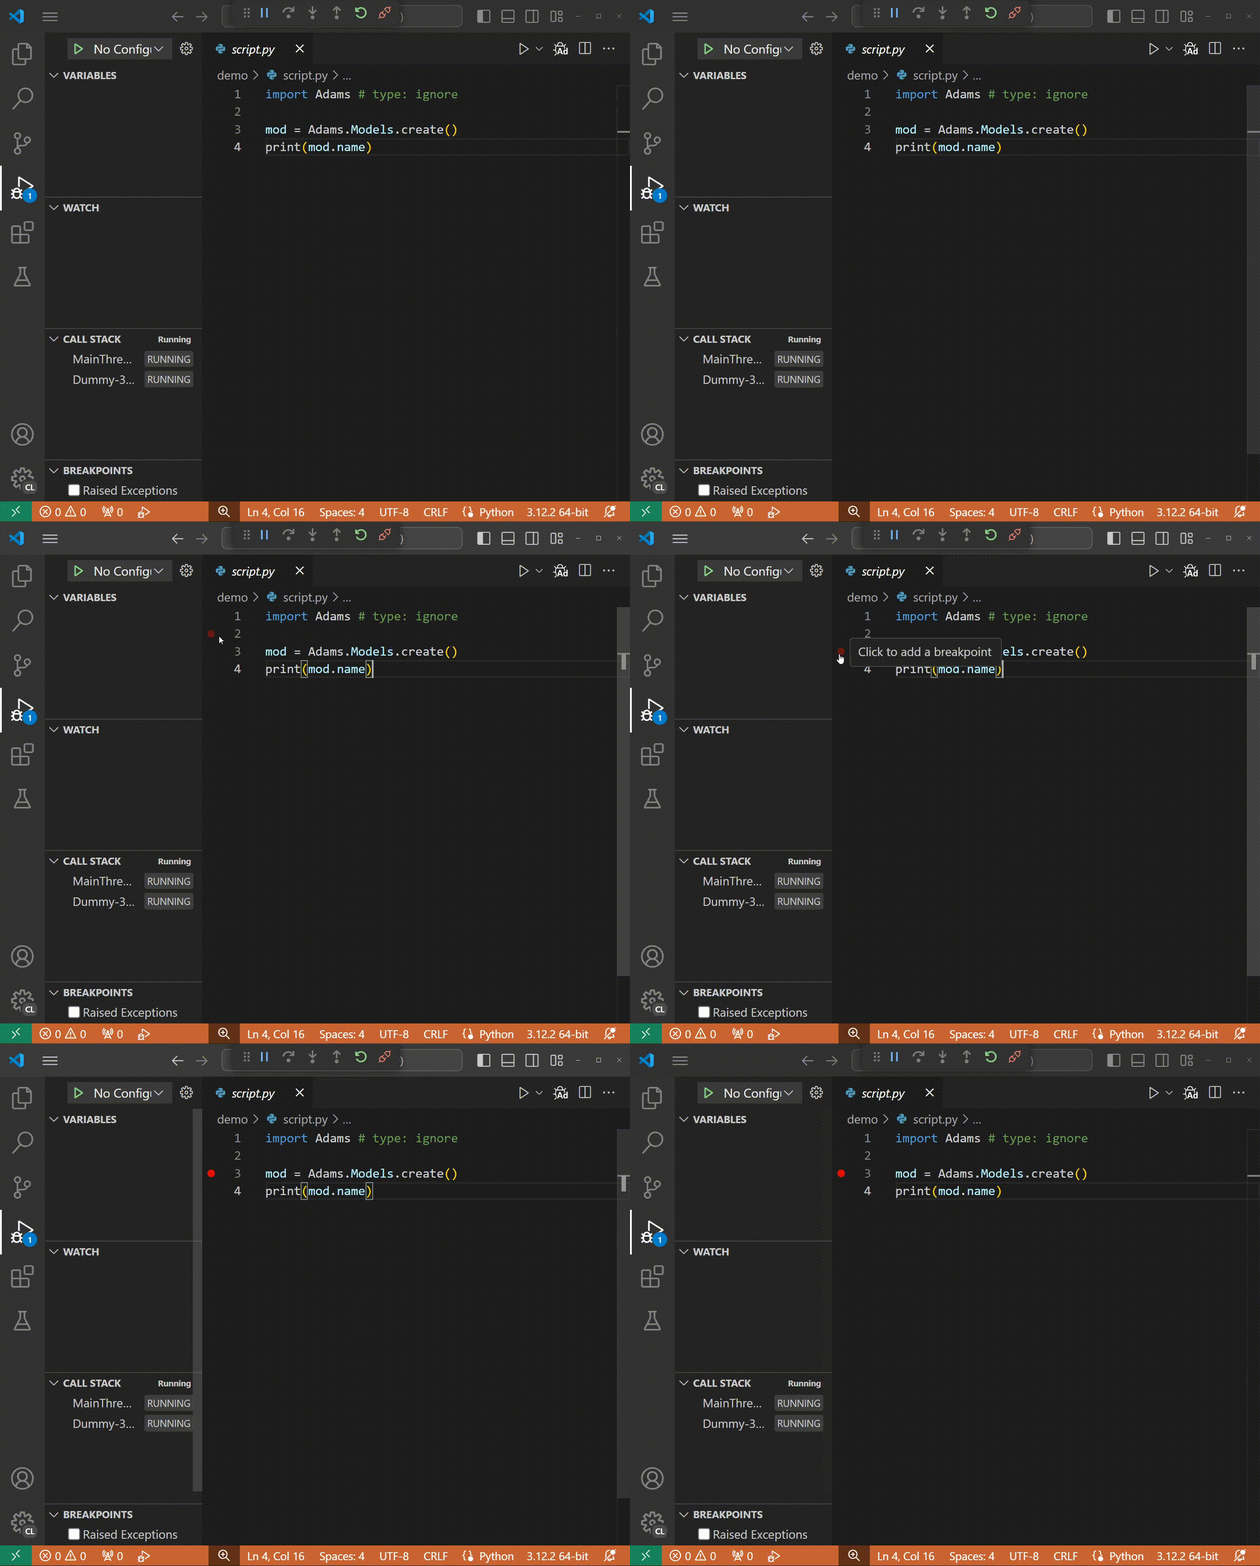
Set a breakpoint
Click in the gutter next to a line of code to set a break point.

Run the script in Adams
Return to Adams View and run the script. The script will pause at the breakpoint you set in vscode.
